DLITE Ohio is a radio telescope that observes at 30-45 MHz and can be used to probe our ionosphere by looking at radio-bright objects in the sky. DLITE Ohio is comprised of four small dipole antennae located on the grounds of Observatory Park in Montville, Ohio. Before, during, and after the total solar eclipse on April 8, 2024, we will use DLITE Ohio, affectionately known as Monty, to observe how the ionosphere reacts to the sudden removal of radiation from the sun.
This project is driven by undergraduate students at Hillsdale College and a graduate student at the Rochester Institute of Technology, and heavily supported by staff and faculty at Observatory Park, Hillsdale College, the National Radio Astronomy Observatory, and the Naval Research Laboratory (NRL). Funding for the telescope was supplied through the AAS Jay M. Pasachoff Solar Eclipse Mini-Grants Program and generous donations of telescope parts from Hillsdale College and the NRL.
Live Data Feed from DLITE Ohio
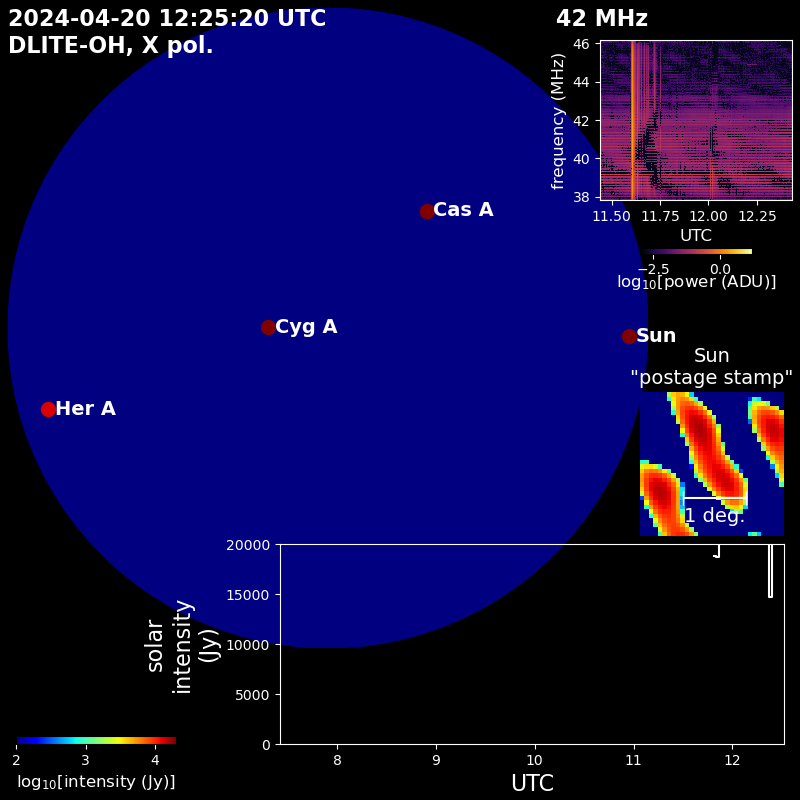
Live data being taken at Observatory Park with DLITE Ohio. The image is refreshed every 30 seconds.
What is the livestream telling us?
.jpg)
Sky Map
This section of the live data stream shows the locations and brightness of all the major radio sources visible with DLITE. Sources at any given time may include the Sun and up to four so-called "A-Team" sources (Cas A, Cyg A, Tau A, and Her A), the brightest radio objects in the sky in the radio light ranges that DLITE observes. Of particular interest for this project is Cas A, a supernova remnant in the constellation Cassiopeia. We will be specifically observing Cas A during the eclipse to see how the ionosphere changes when the sun is obscured by the moon.
Sun "postage stamp"
This section of the live stream data is a "zoom in" on our observational data of the sun. During the eclipse, the sun will slowly dim and should disappear. However, at the radio frequencies DLITE Ohio observes the sky, the emission from the sun is highly variable, so we have to use other methods to make sure the dimming we see is truly caused by the eclipse.
Intensity of the Sun Plot
This section tracks the intensity of the sun over many days leading up to the eclipse. On April 8th, when the eclipse begins, the intensity of the sun will start to decrease. Tracking the intensity of the sun leading up to and after the eclipse will allow us to better understand the emission of the sun at 43 MHz.
Dynamic Bispectrum
A dynamic bispectrum is created by a unique method of averaging the data from each of our four antennae together and helps to determine if the data we see in our feeds is just interference or real solar activity.